Tune for Max CPU with NiFi on Minikube
Updated:
Yesterday I built a simple but brutal benchmark flow for Apache NiFi. The goal? Push a default minimal NiFi cluster on Minikube to the absolute limits of memory and CPU — without crashing it. Or Did I? ![]()
The flow JSON I used is here:
NiFiBenchMarkTest.json
I ran everything on a Windows-hosted Minikube cluster (6 CPUs, 16 GB RAM) using a default Cloudera Flow Management (CFM) evaluation deployment. The results were excellent: I hit 99% CPU usage while keeping NiFi rock-solid stable.
All of this setup is fully documented in my blog Cloudera Streaming Operators and in my repo:
ClouderaStreamingOperators.
 Setting Up the NiFi Flow
Getting this NiFi Flow going is pretty easy, use the Flow Definition File I provided and follow along in the NiFi UI.
- Download the benchmark flow JSON linked above.
- In the NiFi UI, go to the canvas, drag out a new process group and click the button outlined in red to upload:
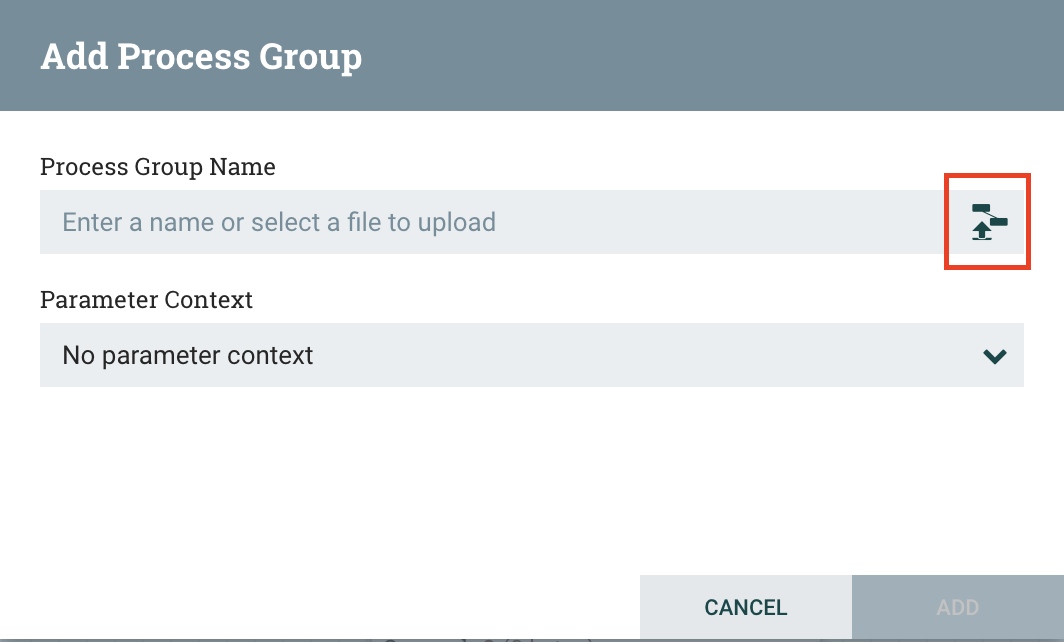
- The imported flow should look as follows:
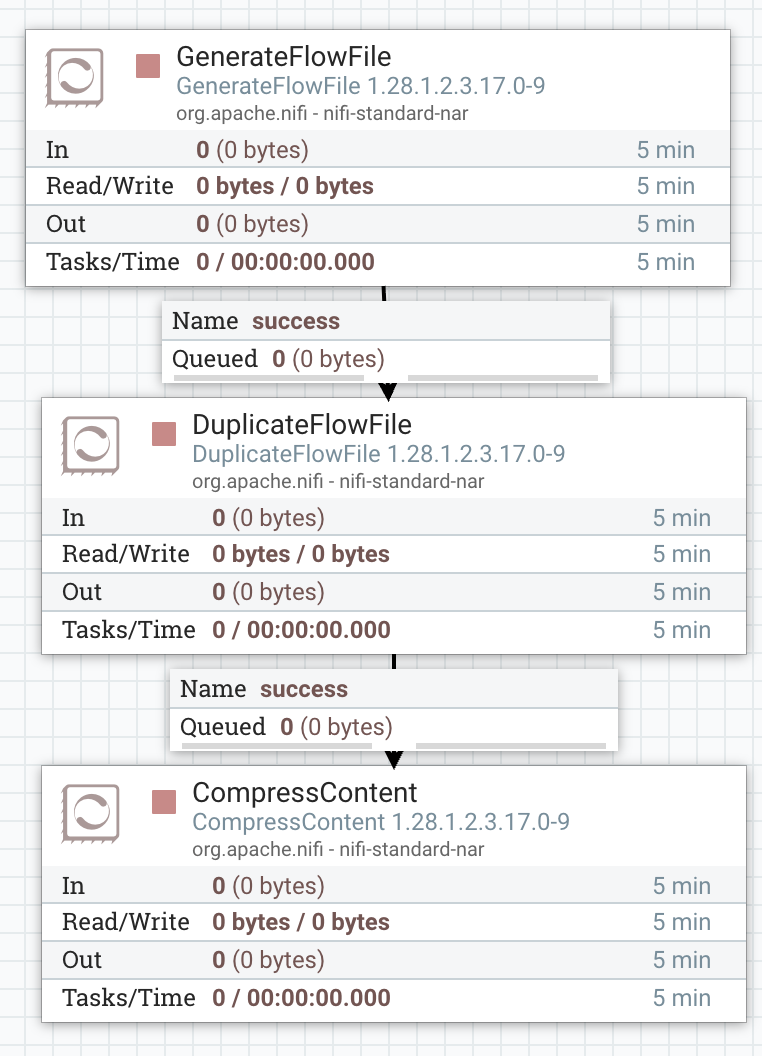
-
Do not change anything — leave all concurrency settings, thread pools, and queue back-pressure at their factory defaults.
- Start the entire flow.
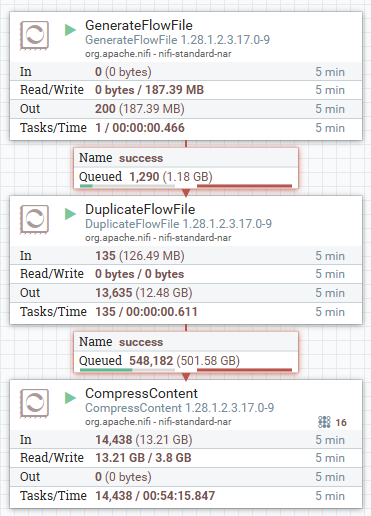
You’ll immediately see data flowing. The flow generates synthetic records, duplicates them aggressively, and compresses them — exactly the kind of workload that hammers both CPU and memory.
![]() Danger! This next section are settings from my final iteration. Depending on your enviornment you need to scale your settings from default to higher number as I describe here. For example I started with 10gb, 10,000, and 2 concurrency and slowly incremement over iterations.
Danger! This next section are settings from my final iteration. Depending on your enviornment you need to scale your settings from default to higher number as I describe here. For example I started with 10gb, 10,000, and 2 concurrency and slowly incremement over iterations.
 Tuning for Maximum Load
Once you confirm the flow is stable with defaults, it’s time to open the throttle.
Set Concurrency on CompressContent
- Right-click the CompressContent processor → Configure
- Go to the Scheduling tab
- Change Concurrent Tasks from the default (usually 1) to
16
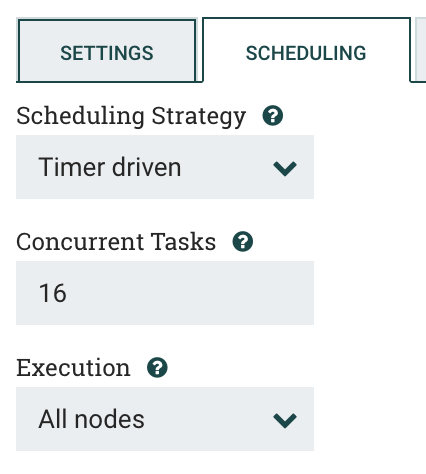
This lets 16 parallel threads chew through the heavy compression work.
Increase the Active Thread Pool
- Open your NiFi controller settings
- Raise the Maximum Timer Driven Thread Count to
32(roughly 4× my CPU cores for aggressive tuning)
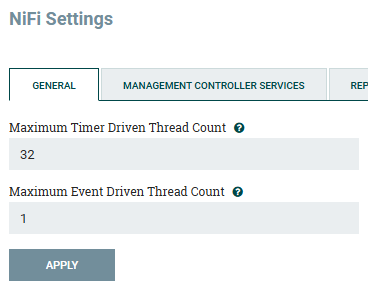
This gives NiFi far more total threads to work with across the entire cluster.
Crank Up Queue Sizes
- Click each Success Connection
- GenerateFlowFile → DuplicateFlowFile
- DuplicateFlowFile → CompressContent
- Edit the connection properties as follows
- Set Back Pressure Object Threshold to
500000 - Set the object Size Threshold to
500GB
- Set Back Pressure Object Threshold to
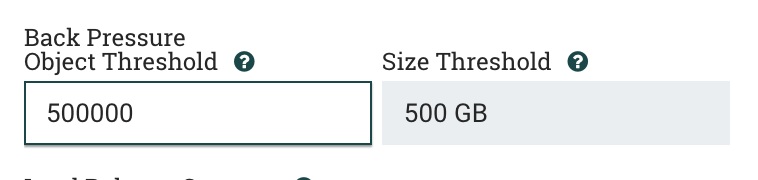
These changes prevent early back-pressure and let the system queue massive amounts of data before throttling.
Apply the changes, restart the affected processors, and watch the magic happen.
![]() Pro Tip! You can also set the Run Duration of a processor while tuning. In the test above I set my DuplicateFlowfile to 25 ms. Definitely consider how long you want each process thread to run.
Pro Tip! You can also set the Run Duration of a processor while tuning. In the test above I set my DuplicateFlowfile to 25 ms. Definitely consider how long you want each process thread to run.
 Results
With the tuned settings applied, the cluster performed beautifully:
- CPU hit 99% sustained load
- Memory stayed comfortable at ~40–41%
- Queues ballooned to over 500 GB and 500,000+ flowfiles
- The desktop PC fan started spinning slowly… then went to full blast — the best analog indicator that real work is happening!
- NiFi never crashed, even when the monitoring tool screamed “Critical CPU level!”
- I did press stop at this point, no sense in
 for a fun test!
A default minimal evaluation NiFi cluster on Minikube is surprisingly capable once you give it the right concurrency, thread pool, and queue headroom.
Here are the shots I captured during the test runs.
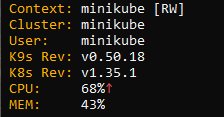
Minikube + k9s View of the cluster building load on CPU.
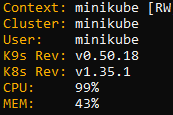
Minikube + k9s view showing 99% CPU utilization.
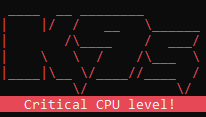
K9s firing a red “Critical CPU level!” warning.
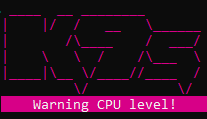
Pink “Warning CPU level!” alert during sustained load.
NiFi flow statistics — over 500 GB queued after DuplicateFlowFile and heavy compression
If your k9s is not showing MEM and CPU metrics execute the following command and give a few moments for the metrics to start updating.
minikube addons enable metrics-server
 Summary
This experiment confirms that even a minimal, default deployment of Apache NiFi on a local Kubernetes environment like Minikube is an absolute powerhouse—provided you know which dials to turn. By simply adjusting the concurrent tasks, expanding the timer-driven thread pool, and giving your queues enough room to breathe, you can transform a modest 6-core setup into a high-performance data processing lab.
The most impressive takeaway wasn’t just hitting 99% CPU utilization; it was that NiFi remained completely stable and the UI stayed responsive throughout the entire stress test. Whether you are running on a massive production cluster or a local laptop, the same principles apply: Test, Tune, and don’t be afraid to listen for the ![]() !
!
Happy tuning — go push your NiFi clusters to the limit! 🚀
📚 Resources
Tune for Max CPU with NiFi on Minikube
Please reach out to schedule a discussion if you would like a deeper dive, hands on experience, or demos of the integration between these components.