Monitoring Cloudera Streams Messaging (CSM) with Prometheus
Updated:
Apache Kafka is the undeniable backbone of modern real-time data, but monitoring its internal health on Kubernetes can often feel like trying to pick a lock. While the Strimzi-powered Cloudera Streams Messaging (CSM) Operator effortlessly spins up your brokers, the critical metrics you need to keep things running smoothly—like byte throughput and under-replicated partitions—are trapped deep inside the JVM. Because Prometheus doesn’t natively speak JMX, we can’t just open a port and call it a day.
In Part 1 of this series, we are going to crack open that black box around Kafka. We will walk step-by-step through injecting a custom JMX Prometheus Exporter into your CSM cluster and deploying a specialized PodMonitor to translate those buried JVM metrics into crystal-clear results in Prometheus and Grafana.
The Metrics ConfigMap
First, we need to define how Kafka’s JMX metrics are converted into Prometheus format. Create kafka-metrics-config.yaml:
kind: ConfigMap
apiVersion: v1
metadata:
  name: kafka-metrics
  labels:
    app: strimzi
data:
  kafka-metrics-config.yaml: |
    # See https://github.com/prometheus/jmx_exporter for more info about JMX Prometheus Exporter metrics
    lowercaseOutputName: true
    rules:
    # Special cases and very specific rules
    - pattern: kafka.server<type=(.+), name=(.+), clientId=(.+), topic=(.+), partition=(.*)><>Value
      name: kafka_server_$1_$2
      type: GAUGE
      labels:
        clientId: "$3"
        topic: "$4"
        partition: "$5"
    - pattern: kafka.server<type=(.+), name=(.+), clientId=(.+), brokerHost=(.+), brokerPort=(.+)><>Value
      name: kafka_server_$1_$2
      type: GAUGE
      labels:
        clientId: "$3"
        broker: "$4:$5"
    - pattern: kafka.server<type=(.+), cipher=(.+), protocol=(.+), listener=(.+), networkProcessor=(.+)><>connections
      name: kafka_server_$1_connections_tls_info
      type: GAUGE
      labels:
        cipher: "$2"
        protocol: "$3"
        listener: "$4"
        networkProcessor: "$5"
    - pattern: kafka.server<type=(.+), clientSoftwareName=(.+), clientSoftwareVersion=(.+), listener=(.+), networkProcessor=(.+)><>connections
      name: kafka_server_$1_connections_software
      type: GAUGE
      labels:
        clientSoftwareName: "$2"
        clientSoftwareVersion: "$3"
        listener: "$4"
        networkProcessor: "$5"
    - pattern: "kafka.server<type=(.+), listener=(.+), networkProcessor=(.+)><>(.+-total):"
      name: kafka_server_$1_$4
      type: COUNTER
      labels:
        listener: "$2"
        networkProcessor: "$3"
    - pattern: "kafka.server<type=(.+), listener=(.+), networkProcessor=(.+)><>(.+):"
      name: kafka_server_$1_$4
      type: GAUGE
      labels:
        listener: "$2"
        networkProcessor: "$3"
    - pattern: kafka.server<type=(.+), listener=(.+), networkProcessor=(.+)><>(.+-total)
      name: kafka_server_$1_$4
      type: COUNTER
      labels:
        listener: "$2"
        networkProcessor: "$3"
    - pattern: kafka.server<type=(.+), listener=(.+), networkProcessor=(.+)><>(.+)
      name: kafka_server_$1_$4
      type: GAUGE
      labels:
        listener: "$2"
        networkProcessor: "$3"
    # Some percent metrics use MeanRate attribute
    # Ex) kafka.server<type=(KafkaRequestHandlerPool), name=(RequestHandlerAvgIdlePercent)><>MeanRate
    - pattern: kafka.(\w+)<type=(.+), name=(.+)Percent\w*><>MeanRate
      name: kafka_$1_$2_$3_percent
      type: GAUGE
    # Generic gauges for percents
    - pattern: kafka.(\w+)<type=(.+), name=(.+)Percent\w*><>Value
      name: kafka_$1_$2_$3_percent
      type: GAUGE
    - pattern: kafka.(\w+)<type=(.+), name=(.+)Percent\w*, (.+)=(.+)><>Value
      name: kafka_$1_$2_$3_percent
      type: GAUGE
      labels:
        "$4": "$5"
    # Generic per-second counters with 0-2 key/value pairs
    - pattern: kafka.(\w+)<type=(.+), name=(.+)PerSec\w*, (.+)=(.+), (.+)=(.+)><>Count
      name: kafka_$1_$2_$3_total
      type: COUNTER
      labels:
        "$4": "$5"
        "$6": "$7"
    - pattern: kafka.(\w+)<type=(.+), name=(.+)PerSec\w*, (.+)=(.+)><>Count
      name: kafka_$1_$2_$3_total
      type: COUNTER
      labels:
        "$4": "$5"
    - pattern: kafka.(\w+)<type=(.+), name=(.+)PerSec\w*><>Count
      name: kafka_$1_$2_$3_total
      type: COUNTER
    # Generic gauges with 0-2 key/value pairs
    - pattern: kafka.(\w+)<type=(.+), name=(.+), (.+)=(.+), (.+)=(.+)><>Value
      name: kafka_$1_$2_$3
      type: GAUGE
      labels:
        "$4": "$5"
        "$6": "$7"
    - pattern: kafka.(\w+)<type=(.+), name=(.+), (.+)=(.+)><>Value
      name: kafka_$1_$2_$3
      type: GAUGE
      labels:
        "$4": "$5"
    - pattern: kafka.(\w+)<type=(.+), name=(.+)><>Value
      name: kafka_$1_$2_$3
      type: GAUGE
    # Emulate Prometheus 'Summary' metrics for the exported 'Histogram's.
    # Note that these are missing the '_sum' metric!
    - pattern: kafka.(\w+)<type=(.+), name=(.+), (.+)=(.+), (.+)=(.+)><>Count
      name: kafka_$1_$2_$3_count
      type: COUNTER
      labels:
        "$4": "$5"
        "$6": "$7"
    - pattern: kafka.(\w+)<type=(.+), name=(.+), (.+)=(.*), (.+)=(.+)><>(\d+)thPercentile
      name: kafka_$1_$2_$3
      type: GAUGE
      labels:
        "$4": "$5"
        "$6": "$7"
        quantile: "0.$8"
    - pattern: kafka.(\w+)<type=(.+), name=(.+), (.+)=(.+)><>Count
      name: kafka_$1_$2_$3_count
      type: COUNTER
      labels:
        "$4": "$5"
    - pattern: kafka.(\w+)<type=(.+), name=(.+), (.+)=(.*)><>(\d+)thPercentile
      name: kafka_$1_$2_$3
      type: GAUGE
      labels:
        "$4": "$5"
        quantile: "0.$6"
    - pattern: kafka.(\w+)<type=(.+), name=(.+)><>Count
      name: kafka_$1_$2_$3_count
      type: COUNTER
    - pattern: kafka.(\w+)<type=(.+), name=(.+)><>(\d+)thPercentile
      name: kafka_$1_$2_$3
      type: GAUGE
      labels:
        quantile: "0.$4"
    # KRaft overall related metrics
    # distinguish between always increasing COUNTER (total and max) and variable GAUGE (all others) metrics
    - pattern: "kafka.server<type=raft-metrics><>(.+-total|.+-max):"
      name: kafka_server_raftmetrics_$1
      type: COUNTER
    - pattern: "kafka.server<type=raft-metrics><>(current-state): (.+)"
      name: kafka_server_raftmetrics_$1
      value: 1
      type: UNTYPED
      labels:
        $1: "$2"
    - pattern: "kafka.server<type=raft-metrics><>(.+):"
      name: kafka_server_raftmetrics_$1
      type: GAUGE
    # KRaft "low level" channels related metrics
    # distinguish between always increasing COUNTER (total and max) and variable GAUGE (all others) metrics
    - pattern: "kafka.server<type=raft-channel-metrics><>(.+-total|.+-max):"
      name: kafka_server_raftchannelmetrics_$1
      type: COUNTER
    - pattern: "kafka.server<type=raft-channel-metrics><>(.+):"
      name: kafka_server_raftchannelmetrics_$1
      type: GAUGE
    # Broker metrics related to fetching metadata topic records in KRaft mode
    - pattern: "kafka.server<type=broker-metadata-metrics><>(.+):"
      name: kafka_server_brokermetadatametrics_$1
      type: GAUGE
Apply the yaml:
kubectl apply -f kafka-metrics-config.yaml -n cld-streaming
The Kafka Cluster Config
Create the kafka-nodepool.yaml:
apiVersion: kafka.strimzi.io/v1
kind: KafkaNodePool
metadata:
  name: combined
  labels:
    strimzi.io/cluster: my-cluster
spec:
  replicas: 3
  roles:
    - controller
    - broker
  storage:
    type: jbod
    volumes:
      - id: 0
        type: persistent-claim
        size: 10Gi
        kraftMetadata: shared
        deleteClaim: false
Apply the yaml:
kubectl apply -f kafka-nodepool.yaml -n cld-streaming`
Create the kafka-eval-prometheus.yaml:
apiVersion: kafka.strimzi.io/v1
kind: Kafka
metadata:
  name: my-cluster
  annotations:
    strimzi.io/node-pools: enabled
    strimzi.io/kraft: enabled
spec:
  kafka:
    version: 4.1.1.1.6
    metricsConfig:
      type: jmxPrometheusExporter
      valueFrom:
        configMapKeyRef:
          name: kafka-metrics
          key: kafka-metrics-config.yaml
    listeners:
      - name: plain
        port: 9092
        type: internal
        tls: false
      - name: tls
        port: 9093
        type: internal
        tls: true
    config:
      offsets.topic.replication.factor: 3
      transaction.state.log.replication.factor: 3
      transaction.state.log.min.isr: 2
      default.replication.factor: 3
      min.insync.replicas: 2
  entityOperator:
    topicOperator: {}
    userOperator: {}
Apply the yaml:
kubectl apply -f kafka-eval-prometheus.yaml -n cld-streaming
Discovery with PodMonitor
Now we tell Prometheus to go find our brokers. Create our PodMoinitor strimzi-pod-monitor.yaml:
apiVersion: monitoring.coreos.com/v1
kind: PodMonitor
metadata:
  name: strimzi-pod-monitor
  namespace: cld-streaming
  labels:
    release: prometheus
spec:
  selector:
    matchLabels:
      strimzi.io/cluster: my-cluster
      strimzi.io/kind: Kafka
  namespaceSelector:
    matchNames:
      - cld-streaming
  podMetricsEndpoints:
    - path: /metrics
      targetPort: 9404
      interval: 30s
      relabelings:
        # Map Strimzi pod labels (strimzi.io/...) to top-level metric labels the dashboard expects
        - action: labelmap
          regex: __meta_kubernetes_pod_label_(strimzi_io_.+)
          replacement: $1
        - action: labelmap
          regex: __meta_kubernetes_pod_label_(.+)
          replacement: $1
        # Standard K8s labels the dashboard variables use
        - sourceLabels: [__meta_kubernetes_namespace]
          targetLabel: namespace
        - sourceLabels: [__meta_kubernetes_pod_name]
          targetLabel: kubernetes_pod_name
        - sourceLabels: [__meta_kubernetes_pod_name]
          targetLabel: pod_name
        - sourceLabels: [__meta_kubernetes_pod_node_name]
          targetLabel: node_name
Apply the yaml:
kubectl apply -f strimzi-pod-monitor.yaml -n cld-streaming
Querying Kafka Metrics in Prometheus UI
You should you have the Prometheus UI exposed via minikube service and your strimzi-pod-monitor shows 3/3 targets UP.
- Verification: Go to
Status -> Targets. Look forstrimzi-pod-monitor. It should be UP.
Now you can start exploring live metrics from your CSM Operator Kafka cluster in real time.
The JMX Prometheus Exporter is successfully scraping your brokers on port 9404. Your Kafka brokers are named my-cluster-combined-* due to the combined KafkaNodePool.
In the Prometheus UI switch to the Graph tab, and paste in the queries below.
Sample Query 1: Topic Messages In Per Second (Confirmed Throughput)
sum(rate(kafka_server_brokertopicmetrics_messagesin_total{topic=~"txn1|txn2|txn_fraud"}[5m])) by (pod, topic)
This query aggregates messages ingested per second, grouped by broker pod and topic. Watch it spike when your producers or NiFi flows push data into the txn topics. Excellent for spotting sudden drops or imbalances across brokers.
Sample Query 2: Topic Bytes In Per Second (Throughput in Bytes)
sum(rate(kafka_server_brokertopicmetrics_bytesin_total[5m])) by (topic)
This query shows the incoming byte rate per topic over a 5-minute window. It gives you a clear picture of actual data volume flowing into txn1, txn2, and especially txn_fraud. Because it uses rate(), the graph is much smoother and more useful for monitoring real-world throughput.
Quick Tips for This Setup
-
Filter by your actual broker pods when needed:
sum(rate(kafka_server_brokertopicmetrics_bytesin_total{namespace="cld-streaming"}[5m])) by (topic, pod) -
Add namespace filtering for cleaner results:
sum(rate(kafka_server_brokertopicmetrics_bytesin_total{namespace="cld-streaming"}[5m])) by (topic) -
If any query returns no data, make sure you are actively producing messages to the topics. Then restart Prometheus to force a fresh scrape:
kubectl rollout restart statefulset prometheus-prometheus-kube-prometheus-prometheus -n cld-streaming
Run these sample queries while your NiFi flow is actively sending data to txn1, txn2, and txn_fraud. You should now see clear, live throughput numbers appearing in the Prometheus graphs.
This gives you immediate visibility into both message rate and data volume — perfect for evaluating how well your CSM Opeator deployed Kafka cluster is handling the workload.
Visualizing CSM Kafka with Grafana Dashboards
With Prometheus feeding live data, Grafana turns those raw metrics into professional dashboards. However, “no data” is a common issue at this stage — usually because Prometheus is not yet scraping the Kafka brokers or the dashboard variables don’t match your labels.
Open Grafana (minikube service grafana -n cld-streaming). Login with admin and the password from the secret (see Section 4).
Verify the Prometheus Data Source
Go to Configuration → Data Sources.
- The “Prometheus” source should point to something like
http://prometheus-operated.monitoring.svc:9090. - Click Save & Test. It must say “Data source is working”.
(Note: The “Test” button is at the bottom of the datasource edit page.)
Import the Cloudera CSM Kafka Dashboard
- Download the JSON:
curl -O https://raw.githubusercontent.com/cldr-steven-matison/ClouderaStreamingOperators/refs/heads/main/csm-kafka-dashboard.json - In Grafana → Dashboards → New → Import
- Click Upload JSON file and select the downloaded file.
- On the next screen:
- Datasource → select your Prometheus data source
- Click Import
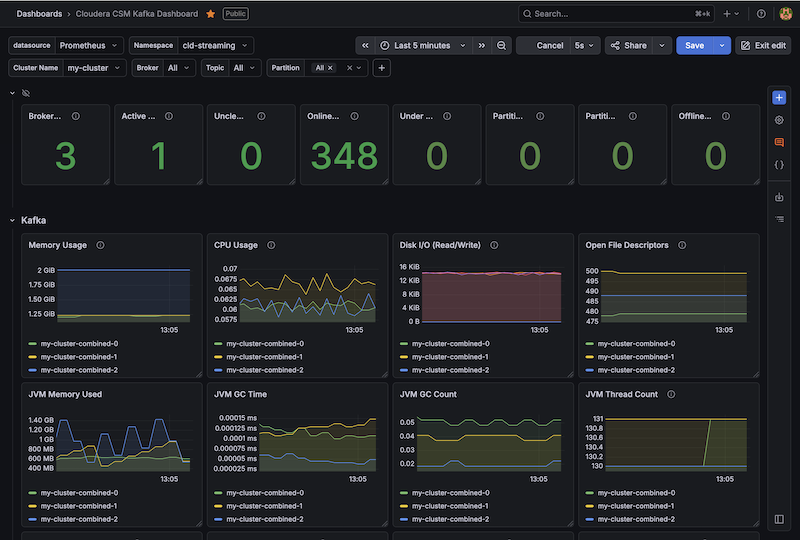
Boom. You now have the new Cloudera CSM Kafka Dashboard in Grafana:
Summary
With the JMX exporter successfully injected and the PodMonitor active, you have cleared the first major hurdle in building an end-to-end observability pipeline. We didn’t just flip a switch; we architected a robust, Kubernetes-native discovery mechanism that respects the Strimzi-based Operator’s strict validation rules while still providing deep, granular visibility into broker performance.
By bridging the gap between Kafka’s internal JMX metrics and Prometheus, you now have the observability needed to monitor everything from message rates to partition health. Whether you are troubleshooting high CPU usage on a specific broker or watching for under-replicated partitions during a scaling event, you now have the raw data required to maintain a healthy cluster.
This setup serves as the foundation for the rest of Cloudera Streaming Operator stack. Now that your event backbone (Kafka) is visible, you are ready to plug in your ingestion (NiFi) and processing (Flink) engines to achieve that elusive “single pane of glass” view across the entire data lifecycle in kubernetes.
Lets move to the next post where we wire up CFM (NiFi 2.0) to this same stack!
Part 2: Monitoring Cloudera Flow Management (CFM) with Prometheus
Terminal History
helm install strimzi-cluster-operator --namespace cld-streaming --set 'image.imagePullSecrets[0].name=cloudera-creds' --set-file clouderaLicense.fileContent=./license.txt --set watchAnyNamespace=true oci://container.repository.cloudera.com/cloudera-helm/csm-operator/strimzi-kafka-operator --version 1.6.0-b99
kubectl apply -f kafka-metrics-config.yaml -n cld-streaming
kubectl apply -f kafka-nodepool.yaml -n cld-streaming
kubectl apply -f kafka-eval-prometheus.yaml -n cld-streaming
kubectl apply -f strimzi-pod-monitor.yaml -n cld-streaming
kubectl delete -f kafka-metrics-config.yaml -n cld-streaming
kubectl delete -f kafka-nodepool.yaml  -n cld-streaming
kubectl delete -f kafka-eval-prometheus.yaml -n cld-streaming
kubectl delete -f strimzi-pod-monitor.yaml -n cld-streaming
helm uninstall strimzi-cluster-operator --namespace cld-streaming
kubectl logs my-cluster-combined-0 -n cld-streaming
minikube service prometheus-kube-prometheus-prometheus -n cld-streaming --url
kubectl get configmap kafka-metrics -n cld-streaming -o jsonpath='{.data}' | jq 'keys'
kubectl get pvc,pv -n cld-streaming
minikube ssh "sudo rm -rf /tmp/hostpath-provisioner/cld-streaming/*"
kubectl delete kafka my-cluster -n cld-streaming
kubectl delete pvc -l strimzi.io/cluster=my-cluster -n cld-streaming


#other Prometheus Queries I used

{__name__=~"kafka_server_brokertopicmetrics.*"}
kafka_server_brokertopicmetrics_messagesinpersec{topic="txn1"}
kafka_server_brokertopicmetrics_messagesinpersec{topic="txn2"}
kafka_server_brokertopicmetrics_messagesinpersec{topic="txn_fraud"}

#working sums
sum(kafka_server_brokertopicmetrics_messagesinpersec{topic=~"txn1|txn2|txn_fraud"}) by (topic)
sum(kafka_server_brokertopicmetrics_messagesinpersec{topic=~"txn1|txn2|txn_fraud"}) by (pod, topic)

# in this session, a :lightbulb: moment.   When helm upgrade failed  rollback worked to revert
# also be careful in test iterations,  if we do a live patch,  we need to make sure we go back to get the same change reflected in cli or yaml commands


cd ~/Documents/GitHub/ClouderaStreamingOperators
kubectl apply -f strimzi-pod-monitor.yaml -n cld-streaming
kubectl get podmonitors -n cld-streaming
kubectl get secret --namespace monitoring prometheus-grafana -o jsonpath="{.data.admin-password}" | base64 --decode ; echo
kubectl get secret --namespace cld-streaming -l app.kubernetes.io/component=admin-secret -o jsonpath="{.items[0].data.admin-password}" | base64 --decode ; echo
kubectl get podmonitors -n cld-streaming
kubectl exec -it my-cluster-combined-0 -n cld-streaming -- curl localhost:9404/metrics
kubectl patch podmonitor strimzi-pod-monitor -n cld-streaming --type merge -p '{"spec":{"jobLabel":"strimzi.io/cluster"}}'
helm upgrade prometheus prometheus-community/kube-prometheus-stack \\n  --namespace cld-streaming \\n  --reuse-values \\n  --set 'grafana.additionalDataSources[0].jsonData.timeInterval=30s' \\n  --set 'grafana.additionalDataSources[0].jsonData.httpMethod=POST' \\n  --set 'grafana.additionalDataSources[0].jsonData.incrementalQuerying=true'
helm rollback prometheus -n cld-streaming
helm upgrade prometheus prometheus-community/kube-prometheus-stack \\n  --namespace cld-streaming \\n  --reuse-values \\n  --set 'grafana.sidecar.datasources.isDefaultDatasourceEditable=true' \\n  --set 'grafana.additionalDataSources[0].jsonData.scrapeInterval=30s'
kubectl get secret --namespace cld-streaming -l app.kubernetes.io/component=admin-secret -o jsonpath="{.items[0].data.admin-password}" | base64 --decode ; echo
helm rollback prometheus -n cld-streaming
kubectl get secret --namespace cld-streaming -l app.kubernetes.io/component=admin-secret -o jsonpath="{.items[0].data.admin-password}" | base64 --decode ; echo
helm uninstall prometheus -n cld-streaming
Appendix
1. Full Delete + Rebuild (prevents stale config caching)
kubectl delete kafka my-cluster -n cld-streaming --ignore-not-found
kubectl delete pvc -l strimzi.io/cluster=my-cluster -n cld-streaming --ignore-not-found
kubectl delete configmap kafka-metrics -n cld-streaming --ignore-not-found
kubectl delete podmonitor strimzi-pod-monitor -n cld-streaming --ignore-not-found

minikube ssh "sudo rm -rf /tmp/hostpath-provisioner/cld-streaming/*"

# Optional but clean: restart operator if you hit bad state
helm uninstall strimzi-cluster-operator --namespace cld-streaming
# Re-install (your exact command)
helm install strimzi-cluster-operator --namespace cld-streaming \
  --set 'image.imagePullSecrets[0].name=cloudera-creds' \
  --set-file clouderaLicense.fileContent=./license.txt \
  --set watchAnyNamespace=true \
  oci://container.repository.cloudera.com/cloudera-helm/csm-operator/strimzi-kafka-operator --version 1.6.0-b99
2. Source of Kafka Metrics
curl -O https://raw.githubusercontent.com/strimzi/strimzi-kafka-operator/main/examples/metrics/kafka-metrics.yaml
kubectl apply -f kafka-metrics.yaml -n cld-streaming
4. Re-apply Kafka resources (in order)
kubectl apply -f kafka-nodepool.yaml -n cld-streaming
kubectl apply -f kafka-eval-prometheus.yaml -n cld-streaming
5. Force Prometheus to pick up changes
kubectl rollout restart statefulset prometheus-prometheus-kube-prometheus-prometheus -n cld-streaming
kubectl rollout restart deployment prometheus-kube-prometheus-operator -n cld-streaming
6. Quick custom panels
Use these in a temporary dashboard (they match your working queries):
- Messages In Per Second
sum(rate(kafka_server_brokertopicmetrics_messagesinpersec{namespace="cld-streaming", topic=~"txn1|txn2|txn_fraud"}[5m])) by (pod, topic) - Bytes In Per Second
sum(rate(kafka_server_brokertopicmetrics_bytesinpersec{namespace="cld-streaming", topic=~"txn1|txn2|txn_fraud"}[5m])) by (topic) - Under Replicated Partitions
sum(kafka_server_replicamanager_underreplicatedpartitions{namespace="cld-streaming", strimzi_io_cluster="my-cluster"}) by (pod)