Monitoring Cloudera Flow Management (CFM) with Prometheus
Updated:
In the previous guide on monitoring Cloudera Streams Messaging (CSM) we added visibility into your Kafka cluster. Data pipelines don’t start at the broker—they often start with NiFi.
When running NiFi via the Cloudera Flow Management (CFM) Operator, securing the cluster with Single User Auth puts the APIs into a strict lockdown. This makes scraping native metrics a bit of a kubernetes challenge.
In this post, we’re going to wire up a secure CFM NiFi 2.x cluster to the Prometheus + Grafana stack, bypassing web authentication safely using mTLS, and ultimately bridging our cross-namespace metrics into a single pane of glass.
The NiFi Cluster Config (The CR)
In NiFi 2.x, Prometheus metrics are built natively into the application; we don’t need an external JMX exporter like Kafka. However, we do need to tell the CFM Operator to disable standard authentication on the metrics endpoint.
Update your Nifi Custom Resource (nifi-cluster.yaml) with the configOverride block:
apiVersion: [cfm.cloudera.com/v1alpha1](https://cfm.cloudera.com/v1alpha1)
kind: Nifi
metadata:
  name: mynifi
  namespace: cfm-streaming
spec:
  replicas: 1
  nifiVersion: "2.6.0"
  security:
    initialAdminIdentity: "admin"
    nodeCertGen:
      issuerRef:
        name: cfm-operator-ca-issuer-signed
        kind: ClusterIssuer
    singleUserAuth:
      enabled: true
      credentialsSecretName: "nifi-admin-creds"
  configOverride:
    nifiProperties:
      upsert:
        nifi.cluster.leader.election.implementation: "KubernetesLeaderElectionManager"
        # Disable standard auth for the prometheus endpoint
        nifi.web.prometheus.metrics.authenticated: "false"
Apply this configuration and allow the NiFi pods to perform a rolling restart if necessary.
The mTLS VIP Bypass (Finding the Cert)
Because we have singleUserAuth: enabled, NiFi will fiercely defend its endpoints—even with the property override above—throwing 401 Unauthorized errors at Prometheus. NiFi expects a login token.
To get around the web login completely, we use Client Certificates (mTLS). The CFM Operator automatically generates a highly privileged cert to talk to NiFi securely. We are going to borrow that cert for Prometheus.
Run this command to find the Operator’s user certificate:
kubectl get secrets -n cfm-streaming | grep kubernetes.io/tls
Look for mynifi-cfm-operator-user-cert. This is our golden ticket which we will take with us below into our NiFi ServiceMonitor.
Discovery with ServiceMonitor
Now we tell Prometheus to scrape NiFi, handing it the certificate so it can breeze past the 401 Unauthorized screens. We also use a relabelings block to ensure the Host header perfectly matches what NiFi’s Jetty server expects (preventing a 400 Bad Request error).
Save this as nifi-service-monitor.yaml:
apiVersion: monitoring.coreos.com/v1
kind: ServiceMonitor
metadata:
  name: nifi-service-monitor
  namespace: cfm-streaming
  labels:
    release: prometheus
spec:
  selector:
    matchLabels:
      app.kubernetes.io/name: server
      app.kubernetes.io/instance: mynifi
  namespaceSelector:
    matchNames:
      - cfm-streaming
  endpoints:
  - port: https
    path: /nifi-api/flow/metrics/prometheus
    interval: 30s
    scheme: https
    tlsConfig:
      insecureSkipVerify: true
      serverName: mynifi-web.cfm-streaming.svc.cluster.local
      # Explicit CA mapping fixes the "none configured" error
      ca:
        secret:
          name: mynifi-cfm-operator-user-cert
          key: ca.crt
      # The mTLS Bypass Client Certs
      cert:
        secret:
          name: mynifi-cfm-operator-user-cert
          key: tls.crt
      keySecret:
        name: mynifi-cfm-operator-user-cert
        key: tls.key
    relabelings:
      - targetLabel: __address__
        replacement: mynifi-web.cfm-streaming.svc.cluster.local:8443
kubectl apply -f nifi-service-monitor.yaml -n cfm-streaming
(Wait about 30 seconds. In your Prometheus UI under Status -> Targets, nifi-service-monitor should now show as 1/1 UP).
Querying NiFi Metrics in Prometheus UI
Now that Prometheus has a secure, authenticated channel to NiFi, let’s look at the data. Open the Prometheus UI Graph tab and test these queries:
Sample Query 1: Total Bytes Queued
sum(nifi_amount_bytes_queued{namespace="cfm-streaming"})
Great for setting up alerts if a downstream system (like Kafka) goes offline and backpressure builds up.
Sample Query 2: Total Items Queued
sum(nifi_amount_items_queued{namespace="cfm-streaming"})
Sample Query 3: Active Threads
sum(nifi_active_threads{namespace="cfm-streaming"})
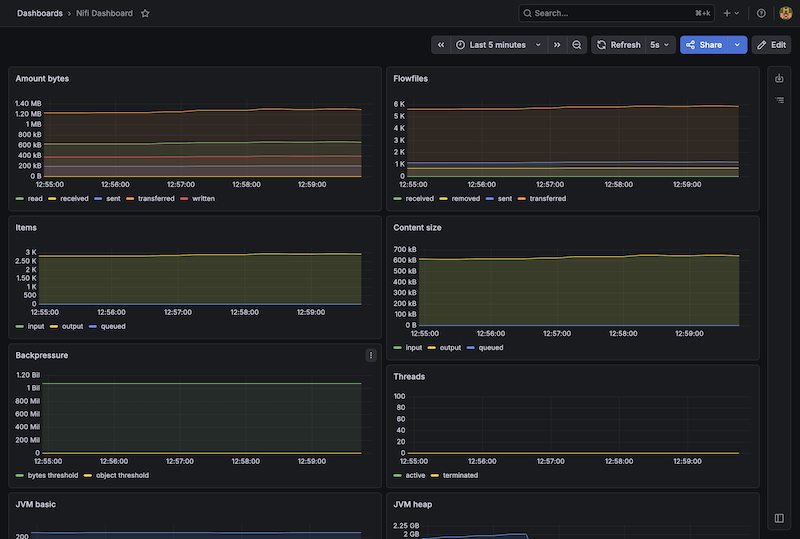
Visualizing CFM NiFi with Grafana Dashboards
With Prometheus pulling the data, let’s load up a beautiful community-built dashboard.
Step 1: Import the Dashboard
- Open Grafana and navigate to Dashboards -> New -> Import.
- In the “Import via grafana.com” box, type
15822(or12375) and click Load. - Select your Prometheus data source at the bottom and click Import.
Boom. You now have full JVM stats, FlowFile queue tracking, and throughput metrics.
Summary
By leveraging the CFM Operator’s native mynifi-cfm-operator-user-cert, you have successfully engineered an mTLS bridge that bypasses NiFi’s strict Single User Auth lockdown. We didn’t just find a workaround for the “401 Unauthorized” errors; we architected a secure, automated discovery path that allows Prometheus to scrape sensitive metrics without compromising the security of your data orchestration layer.
This configuration effectively solves the “networking puzzle” of NiFi 2.x observability. By aligning your ServiceMonitor with NiFi’s strict SNI and Host header requirements, you’ve ensured that your monitoring stack remains as resilient as the pipelines it tracks. You now have the declarative tools to move beyond basic health checks and into deep, cross-namespace correlation.
With this piece of the puzzle in place, you can finally realize the “Master Plan”: a single pane of glass where you can watch NiFi’s outbound data rates flow in perfect synchronization with Kafka’s inbound throughput. You no longer have to guess where a bottleneck resides; you have the real-time telemetry required to prove exactly how data is moving through your entire Cloudera Streaming architecture.
Next Steps: Complete the trifecta by wiring up CSA (Flink) to monitor your real-time processing jobs!
Part 3: Monitoring Cloudera Streaming Analytics (CSA) with Prometheus
Appendix
1. Wiping the ServiceMonitor Configuration
If Prometheus gets “stuck” on an old path or configuration, the cleanest way to force an update is to delete the monitor and re-apply:
kubectl delete servicemonitor nifi-service-monitor -n cfm-streaming
# Wait 30 seconds, then re-apply
kubectl apply -f nifi-service-monitor.yaml -n cfm-streaming
2. Confirming Metric Path Locally
If you want to verify what metrics the endpoint is outputting from inside the cluster using the Operator cert:
kubectl exec mynifi-0 -n cfm-streaming -- curl -k -v --cert /path/to/cert https://localhost:8443/nifi-api/flow/metrics/prometheus
3. Cross-Namespace Panels
To truly see your pipeline in action, add a custom Time Series panel to your dashboard that overlays NiFi’s outbound data directly on top of Kafka’s inbound data.
- Query A (NiFi Send Rate):
sum(rate(nifi_bytes_sent{namespace="cfm-streaming"}[5m])) - Query B (Kafka Receive Rate):
sum(rate(kafka_server_brokertopicmetrics_bytesin_total{namespace="cld-streaming"}[5m]))
If Query A and Query B are flowing together, your pipeline is healthy. If they diverge, you know instantly where the bottleneck is.
4. Hammer Nuke Stuck Pods
If your NiFi pods get stuck in terminate 6/7 give this a try.
kubectl delete pod mynifi-0 -n cfm-streaming --force --grace-period=0