Monitoring Cloudera Streaming Analytics (CSA) with Prometheus
Updated:
If you followed our previous guides on monitoring Cloudera Streams Messaging (CSM) and Cloudera Flow Management (CFM), you now have visibility into your data ingestion (NiFi) and event streaming (Kafka). But what about monitoring the streams processing jobs (FLINK) in Cloudera Streaming Analytics (CSA)?
When running Flink and SQL Stream Builder (SSB) via the CSA Operator, flink jobs spin up dynamically on Kubernetes. Because these dynamically generated TaskManager pods don’t explicitly declare metric ports in their Kubernetes spec, standard Prometheus PodMonitors will silently drop the targets—making job metric discovery a bit of kubernetes spaghetti.
In this third and final post of the series, we’re going to wire up our CSA Flink jobs to our existing Prometheus + Grafana stack. By utilizing a Headless Service to bypass strict pod-spec validation natively, we will finally complete plugging our CFM NiFi Operator, CSA Flink Operator, and CSM Kafka Operator into Prometheus and Grafana stack for monitoring.
Create the Prometheus Values File
Create this file in the root of your repo. This forces Flink to open port 9249 for metrics scraping.
csa-prometheus-values.yaml
# csa-prometheus-values.yaml
# Enables native PrometheusReporter for ALL SQL Stream Builder (SSB) jobs

ssb:
  flinkConfiguration:
    flink-conf.yaml: |
      metrics.reporters: prom
      metrics.reporter.prom.factory.class: org.apache.flink.metrics.prometheus.PrometheusReporterFactory
      metrics.reporter.prom.port: "9249"
      taskmanager.network.detailed-metrics: "true"

      # Optional: cleaner metric labels for Grafana dashboards
      metrics.scope.jm: "flink.jobmanager.<host>"
      metrics.scope.tm: "flink.taskmanager.<host>.<tm_id>"
      metrics.scope.job: "flink.job.<job_id>.<job_name>"
Helm Install Command
Run this exact command:
helm install csa-operator \
  oci://container.repository.cloudera.com/cloudera-helm/csa-operator/csa-operator \
  --namespace cld-streaming \
  --create-namespace \
  --version 1.5.0-b275 \
  --values ./csa-prometheus-values.yaml \
  --set 'flink-kubernetes-operator.imagePullSecrets[0].name=cloudera-creds' \
  --set 'ssb.sse.image.imagePullSecrets[0].name=cloudera-creds' \
  --set 'ssb.sqlRunner.image.imagePullSecrets[0].name=cloudera-creds' \
  --set 'ssb.mve.image.imagePullSecrets[0].name=cloudera-creds' \
  --set 'ssb.database.imagePullSecrets[0].name=cloudera-creds' \
  --set 'ssb.flink.image.imagePullSecrets[0].name=cloudera-creds' \
  --set-file flink-kubernetes-operator.clouderaLicense.fileContent=./license.txt
Verify the Install
# 1. Helm release
helm list -n cld-streaming

# 2. All pods running
kubectl get pods -n cld-streaming

# 3. Confirm Prometheus config was applied
helm get values csa-operator -n cld-streaming | grep -A 20 "flink-conf.yaml"
Discovery with Headless Service & ServiceMonitor
Because Flink Native Kubernetes does not explicitly declare port 9249 in its dynamic pod specs, standard PodMonitors will drop the targets. Instead, we bridge the gap using a Headless Service and a ServiceMonitor.
A. Create the Headless Service (csa-flink-service.yaml)
apiVersion: v1
kind: Service
metadata:
  name: csa-flink-metrics-service
  namespace: cld-streaming
  labels:
    app: csa-flink-metrics
spec:
  clusterIP: None  # Makes it a headless service
  selector:
    # This automatically captures ALL Flink pods (JobManagers & TaskManagers)
    type: flink-native-kubernetes
  ports:
    - name: prom-metrics
      port: 9249
      targetPort: 9249
B. Create the ServiceMonitor (csa-flink-service-monitor.yaml)
apiVersion: [monitoring.coreos.com/v1](https://monitoring.coreos.com/v1)
kind: ServiceMonitor
metadata:
  name: csa-flink-metrics-monitor
  namespace: cld-streaming
  labels:
    release: prometheus # Must match your Prometheus Operator release label
spec:
  selector:
    matchLabels:
      app: csa-flink-metrics
  namespaceSelector:
    matchNames:
      - cld-streaming
  endpoints:
    - port: prom-metrics
      interval: 15s
      scrapeTimeout: 10s
      relabelings:
        # Extracts labels so Grafana dashboards automatically map deployments
        - sourceLabels: [__meta_kubernetes_pod_label_app]
          targetLabel: flink_deployment
        - sourceLabels: [__meta_kubernetes_pod_label_component]
          targetLabel: component
        - sourceLabels: [__meta_kubernetes_pod_name]
          targetLabel: pod
        - sourceLabels: [__meta_kubernetes_namespace]
          targetLabel: namespace
C. Apply both files:
kubectl apply -f csa-flink-service.yaml -n cld-streaming
kubectl apply -f csa-flink-service-monitor.yaml -n cld-streaming
Wait ~30 seconds, then check Prometheus UI (Status -> Targets). You should see your JobManagers and TaskManagers listed as UP under serviceMonitor/cld-streaming/csa-flink-metrics-monitor/0.
Test Prometheus Metrics
- Open SSB UI:
minikube service ssb-sse --namespace cld-streaming -
Run any SQL job in Sql Stream Builder.
- Verify metrics are exposed directly from a pod:
# Replace with your actual taskmanager pod name
kubectl exec -it ssb-session-admin-taskmanager-1-3 -n cld-streaming -- \
  curl -s http://localhost:9249/metrics | head -20
You should see flink_ metrics.
Querying SSB / Flink Metrics in Prometheus UI
Sample Query 1: JVM CPU Load
flink_taskmanager_Status_JVM_CPU_Load{namespace="cld-streaming"}
Sample Query 2: Job Uptime
flink_jobmanager_job_uptime{namespace="cld-streaming"}
Sample Query 3: Records In/Out Per Second
sum(flink_taskmanager_job_task_operator_numRecordsInPerSecond{namespace="cld-streaming"}) by (job_name)
End-to-End Pipeline (NiFi → SSB → Kafka)
sum(rate(nifi_bytes_sent{namespace="cfm-streaming"}[5m]))
or
sum(flink_taskmanager_job_task_operator_numRecordsInPerSecond{namespace="cld-streaming"})
or
sum(rate(kafka_server_brokertopicmetrics_bytesin_total{namespace="cld-streaming"}[5m]))
Visualizing in Grafana
Import the Cloudera CSA Flink Dashboard
- Download the CSA Flink Dashboard JSON:
curl -O https://raw.githubusercontent.com/cldr-steven-matison/ClouderaStreamingOperators/refs/heads/main/csa-flink-dashboard.json - In Grafana → Dashboards → New → Import
- Click Upload JSON file and select the downloaded file.
- On the next screen:
- Datasource → select your Prometheus data source
- Click Import
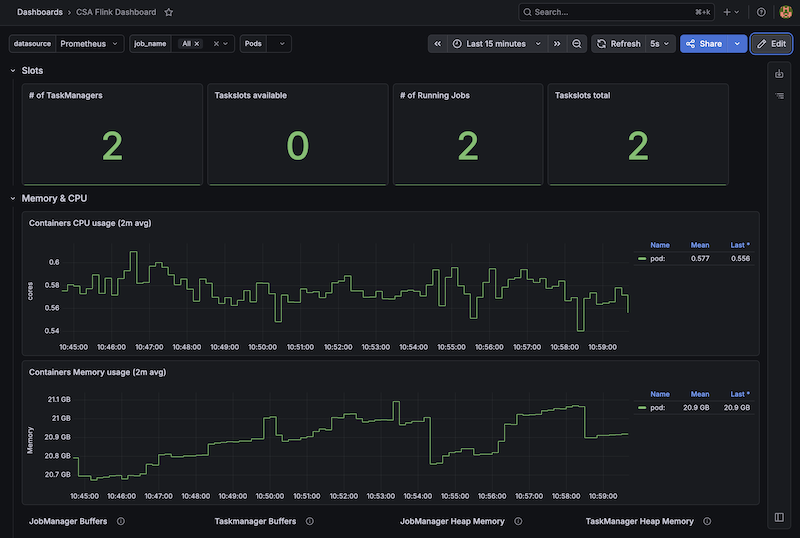
Boom. You now have the new Cloudera CSA Flink Dashboard in Grafana:
Summary
With this final piece in place, you have successfully built a complete, end-to-end observability pipeline across your entire Cloudera Streaming Operators architecture. By bridging CFM (NiFi) for ingestion, CSM (Kafka) for event streaming, and CSA (SQL Stream Builder / Flink) for real-time processing, you now have a unified view of your data’s lifecycle within a single Prometheus and Grafana stack.
In this specific guide we implemented a Headless Service and a ServiceMonitor to bypass the strict pod-spec limitations of Flink Native Kubernetes. This ensures that every dynamically provisioned JobManager and TaskManager is automatically discovered and scraped by Prometheus, completely eliminating the silent “0 targets” discovery failures during setup.
You can now reliably execute complex PromQL queries in Prometheus across namespaces and correlate behavior across entirely different engines. Whether you are tracking backpressure in NiFi, monitoring consumer lag in Kafka, or measuring checkpoint durations and records-per-second in Flink, you finally have the single pane of glass required to confidently debug, tune, scale, and monitor your streaming data pipelines.
Now that we have finished our 3 Parts , let’s go back to the beginnning. Now we can build that End to End Cloudera Streaming Operator Dashboard with Grafana.
Appendix
1. Cleanup / Re-install
helm uninstall csa-operator -n cld-streaming
kubectl delete servicemonitor csa-flink-metrics-monitor -n cld-streaming --ignore-not-found
kubectl delete service csa-flink-metrics-service -n cld-streaming --ignore-not-found
2. Force Prometheus to Re-discover
kubectl rollout restart deployment prometheus-kube-prometheus-operator -n cld-streaming
3. Quick Verification Commands
kubectl get servicemonitor -n cld-streaming
kubectl get service csa-flink-metrics-service -n cld-streaming
kubectl get pods -n cld-streaming -l type=flink-native-kubernetes