Observability with Cloudera Streaming Operators
Updated:
If you are running NiFi Kafka or Flink based applications and workloads in kubernetes, you know that visibility is everything. You can build the most complex data pipelines in the world, but without eyes on your throughput, queues, or other streaming metrics, you’re essentially flying blind.
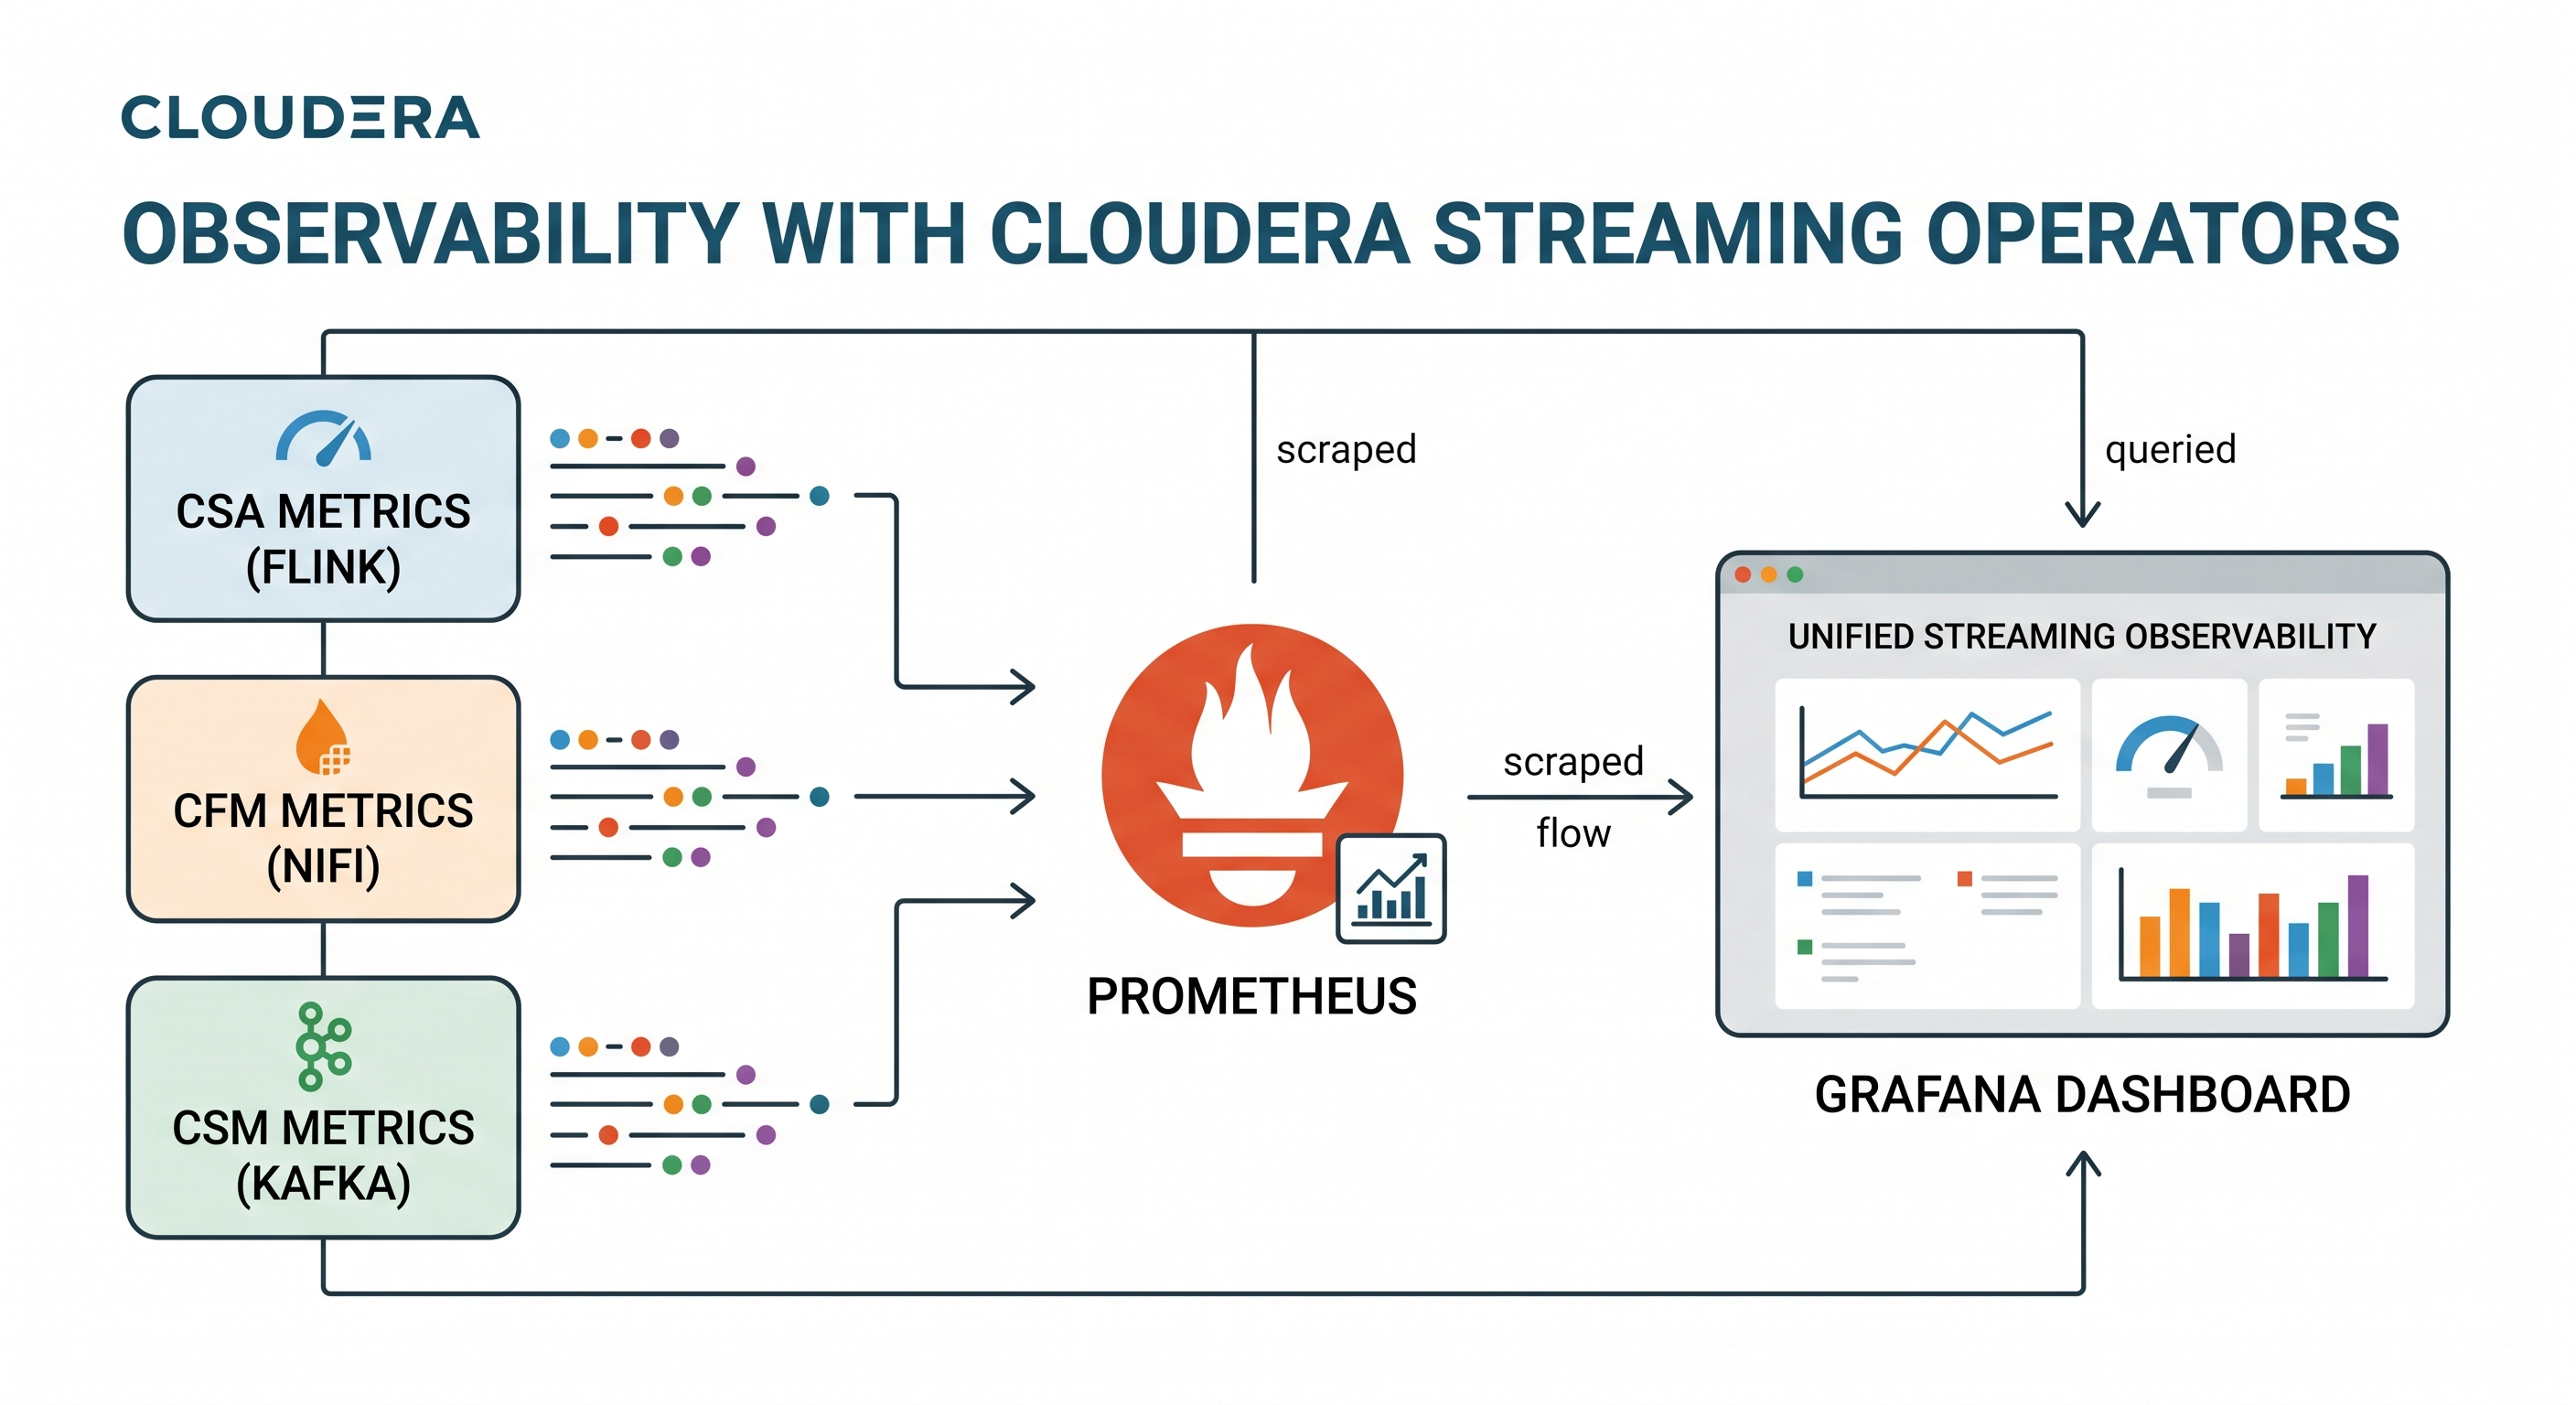
Welcome to the ultimate landing page for my 3 part series on Kubernetes native observability. In this series, we walk through the exact steps to wire up the entire Cloudera Streaming Operator architecture—NiFi, Kafka, and Flink—into a unified Prometheus and Grafana stack.
By the end of this journey, you won’t just have basic health checks; you will have a single pane of glass correlating NiFi’s data flow metrics perfectly with Kafka’s topic throughput and Flink’s stream processing metrics.
Prerequisites
This lesson assumes you have already:
- Completed deployment of Cloudera Streaming Operators
- Have the
minikubebranch of Streams Processing Hands on Lab setup completed, nifi flow is running, topicstxn,tnx2, andtxn_fraudexist, Sql Stream Builder Jobs running with operational polling. - Cloned the latest Cloudera Streaming Operators GitHub repo in ~/ local path.
![]() Warning! Some of the excercises include new helm install commands. Be prepared to use your helm uninstall commands as needed. Install/Uninstall is good practice to reset your stage. However if you are using AI to execute against this plan, you can
Warning! Some of the excercises include new helm install commands. Be prepared to use your helm uninstall commands as needed. Install/Uninstall is good practice to reset your stage. However if you are using AI to execute against this plan, you can helm upgrade or kubectl apply patches to get desired outcome(s).
Prometheus Install
Before diving into the specific operators, you need to install the central monitoring stack. We will be using the community Prometheus Operator. Ensure your Kubernetes environment is ready, and run the following commands to install the Prometheus Operator and Grafana into the cld-streaming namespace.
1. Add the Helm Repo:
helm repo add prometheus-community https://prometheus-community.github.io/helm-charts
2. Install the Kube-Prometheus-Stack:
This specific configuration enables proxy access, sets up the default datasources, and configures the Operator to watch for PodMonitors and ServiceMonitors across all namespaces ({ }).
helm install prometheus prometheus-community/kube-prometheus-stack \
  --namespace cld-streaming --create-namespace \
  --set grafana.sidecar.datasources.defaultDatasourceEnabled=false \
  --set 'grafana.additionalDataSources[0].name=Prometheus' \
  --set 'grafana.additionalDataSources[0].type=prometheus' \
  --set 'grafana.additionalDataSources[0].url=http://prometheus-kube-prometheus-prometheus.cld-streaming.svc.cluster.local:9090' \
  --set 'grafana.additionalDataSources[0].access=proxy' \
  --set 'grafana.additionalDataSources[0].isDefault=true' \
  --set prometheus.prometheusSpec.serviceMonitorSelectorNilUsesHelmValues=false \
  --set prometheus.prometheusSpec.podMonitorSelectorNilUsesHelmValues=false \
  --set-json 'prometheus.prometheusSpec.serviceMonitorNamespaceSelector={}' \
  --set-json 'prometheus.prometheusSpec.podMonitorNamespaceSelector={}'
Exposing the Prometheus and Grafana UIs
Grab the URLs and keep the tunnels alive in separate terminals.
Tab 1: Prometheus UI
minikube service prometheus-kube-prometheus-prometheus -n cld-streaming --url
Tab 2: Grafana UI
minikube service prometheus-grafana -n cld-streaming --url
You can use this command to get the admin password:
kubectl get secret --namespace cld-streaming prometheus-grafana -o jsonpath="{.data.admin-password}" | base64 --decode ; echo
The 3 Part Cloudera Streaming Operators Integration Series
With the observability foundation laid, it’s time to connect the engines. Follow these guides in order to build your end-to-end observability pipeline:
-
Part 1: Monitoring Cloudera Streams Messaging (CSM) with Prometheus
- This guide covers how to inject a custom JMX Exporter configuration and deploy a specialized
PodMonitorto extract metrics from your CSM Operator deployed Kafka cluster.
- This guide covers how to inject a custom JMX Exporter configuration and deploy a specialized
-
Part 2: Monitoring Cloudera Flow Management (CFM) with Prometheus
- Learn how to architect a secure mTLS bypass using the CFM Operator’s own client certificates to safely pull queue tracking and active thread metrics into Prometheus and Grafana.
-
Part 3: Monitoring Cloudera Streaming Analytics (CSA) with Prometheus
- This guide solves the ssb flink and kubernetes networking puzzle using a Headless Service and
ServiceMonitorto capture CSA Operator deployed flink sql job metrics.
- This guide solves the ssb flink and kubernetes networking puzzle using a Headless Service and
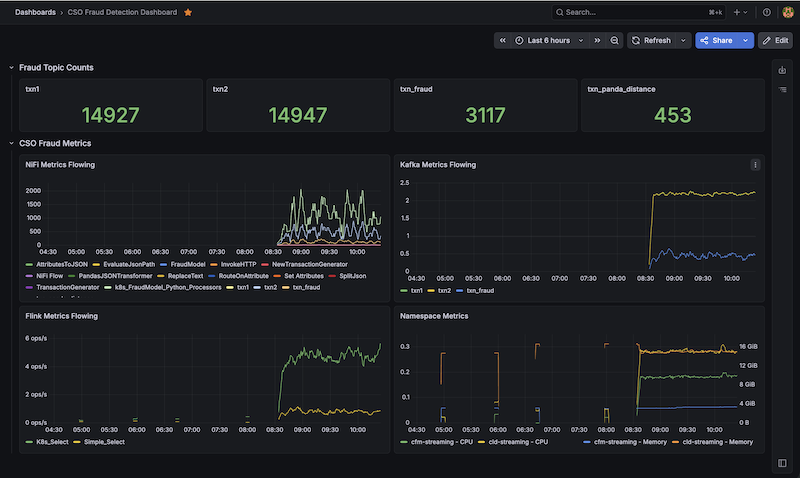
End to End CSO Dashboard with Grafana
Now that we have all of our operator based metrics flowing, all of the operator dashboards setup, and a good understanding of how Prometheus and Grafana queries work. We can easily build a new Fraud Dashboard with Grafana.
Download the CSO Fraud Detection Dashboard JSON and import it into Grafana.
Summary: Observability in Kubernetes Achieved
By wiring CFM (NiFi), CSM (Kafka). CSA (Flink/SSB) metrics to Prometheus, you have successfully built the complete, end-to-end observability of the Cloudera Streaming Operators.
We didn’t just flip a switch to turn on metrics—we architected a robust, Kubernetes-native solution that respects strict SNI headers, leverages mTLS for secure API scraping, and utilizes headless services to bypass dynamic pod-spec limitations. Best of all, your entire monitoring configuration remains declarative and fully Git-trackable.
You can now reliably execute complex PromQL queries across namespaces, correlating behavior across entirely different engines. When you can overlay NiFi’s outbound byte rate directly on top of Kafka’s inbound throughput on the exact same Grafana dashboard, you no longer have to guess where a bottleneck resides. You have the telemetry to prove it.
Resources
- Cloudera Streams Messaging (CSM) 1.6 Docs
- Cloudera Streaming Analytics (CSA) 1.5 Docs
- Cloudera Flow Management (CFM) 3.0 Docs
- Cloudera Streaming Operators GitHub Repo
- Cloudera Streaming Operators Blog
Observability with Cloudera Streaming Operators
If you would like a deeper dive, hands on experience, demos, or are interested in speaking with me further about Observability with Cloudera Streaming Operators please reach out to schedule a discussion.